Combine and visualize your production data with the new Power BI integration from ENLYZE

|
|
|
Data should provide solutions, not create problems. Yet often they are scattered, incomplete, or unstructured. The result: Analyzes are labor-intensive and insights remain elusive.
With the new integration of the ENLYZE Manufacturing Data Platform™ into Microsoft Power BI, you now get the best of both worlds: real-time machine data and one of the strongest tools for data visualization.
Is your company already using Power BI for reporting? With the ENLYZE Power BI integration, you seamlessly integrate your production metrics into existing workflows. All relevant data centralized, clear, and ready for decision-making. Your management will love it – and you save valuable time.
What’s in it for you? Data silos are a thing of the past
With the ENLYZE Power BI Integration, you bring your machine and production data from the ENLYZE Manufacturing Data Platform directly into Power BI and can enrich it with additional data here, creating individual reports and dashboards – all quickly and effortlessly.
Create customized reports for your specific challenges. This opens up entirely new insights: How do production performance and energy costs correlate? Which material batches lead to the highest production scrap? With ENLYZE and PowerBI, you get the insights you need to work more efficiently and achieve better results – all without complicated IT projects or special developments.
Connect Power BI with the ENLYZE Manufacturing Data Platform
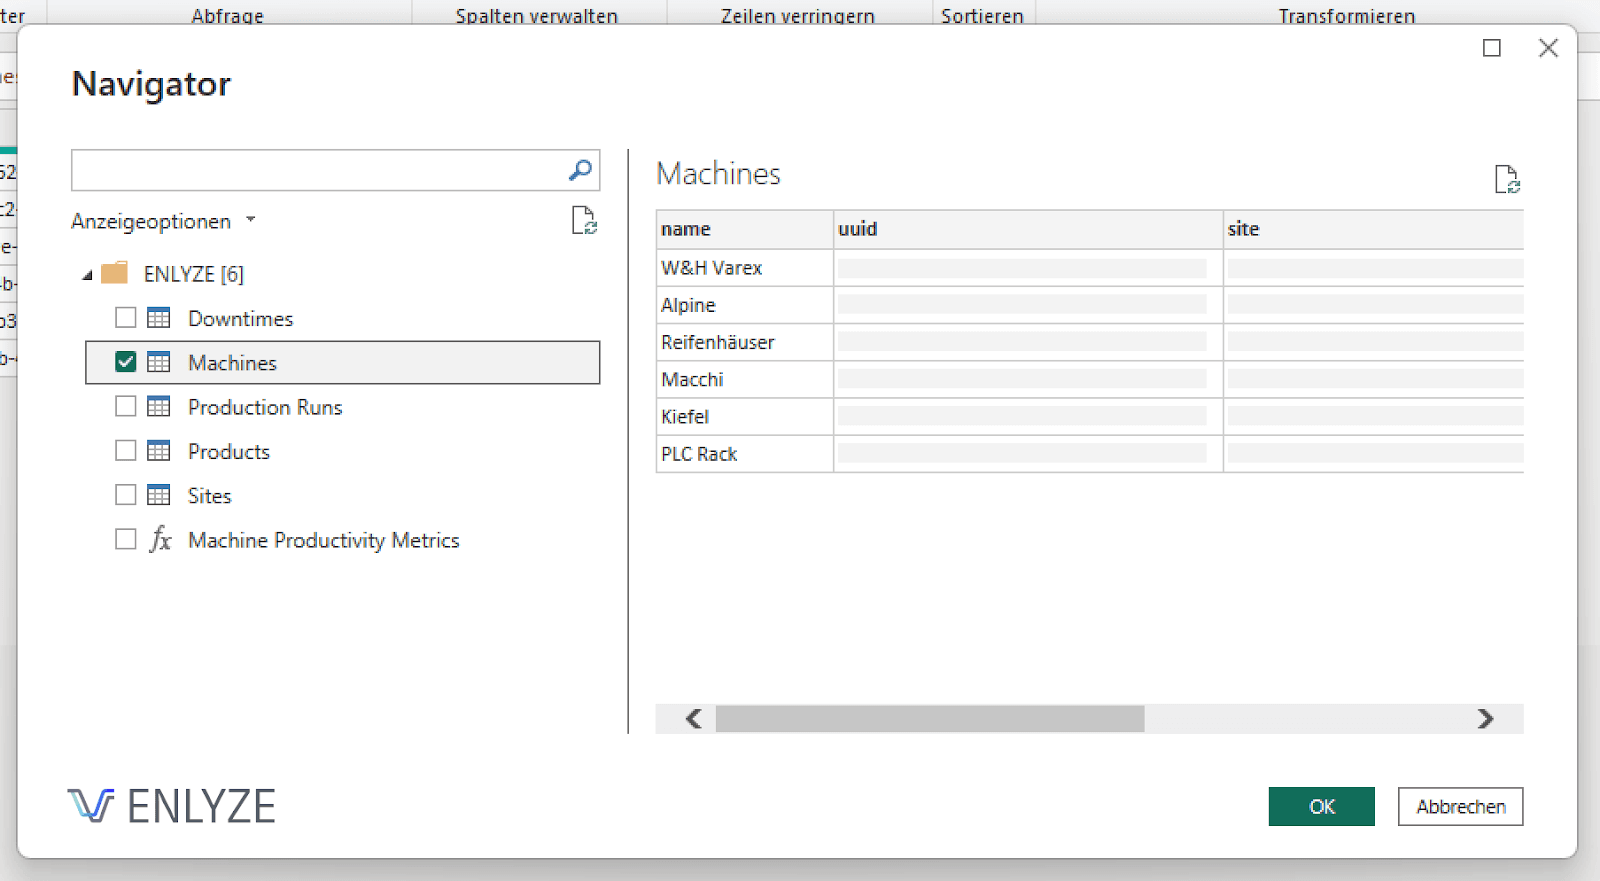
Overview of the transfer of OEE-relevant data for individual plants in Power BI
4 main advantages of the ENLYZE Power BI integration:
Data available directly: No waiting for IT. Your production data is available in Power BI with just a few clicks.
Unlimited visualization options: From OEE to energy consumption to production costs – you decide which use case is important, combine the relevant data, and create customized reports.
More clarity: Combine machine data with ERP, financial, or energy data and discover new relationships. Join our webinar series to see how we implement use cases for recalculation, energy consumption, and CO₂ footprint.
Simple reporting: Everything in one tool – in the future, you can also implement your production reporting in Power BI, avoiding annoying switches between different platforms for your reporting.
Eliminate data silos and start achieving real results. Whether you want to increase your productivity, reduce your CO₂ footprint, or optimize manufacturing costs – with ENLYZE and Power BI, you're ready for data-driven improvements.
Webinar series: Get more out of your machine data: Successfully implement analyses in Power BI
In four 30-minute Power sessions, we show you how to connect ENLYZE with Power BI, use your machine data for analyses and reports in Power BI, and unlock data-driven added value:
Webinar 1: Introduction and guide to the new Power BI integration
Webinar 2: In a production controlling use case, we show how to conduct a precise recalculation based on actual consumption and subsequently examine your product portfolio for profitability.
Webinar 3: In an energy monitoring use case, we show how to capture actual energy consumption for each manufacturing order, determine the specific energy input for your products, and take the next step in energy monitoring.
Webinar 4: Building on the energy monitoring use case, we show how to create the Product Carbon Footprint (PCF) for your product portfolio and thus stay up-to-date in sustainability reporting.
If these topics are of interest to you, register now or share the link with your colleagues responsible for this area.
Why ENLYZE? Data instead of guessing!
ENLYZE makes your machine data accessible – directly from the PLC and sensors, regardless of whether your plant supports OPC or not. Our comprehensive connector portfolio ensures seamless connectivity, even in heterogeneous machine parks. This paves the way for digital manufacturing.
Our platform delivers normalized, enriched real-time production data and ensures that you always get precise, reliable insights into your production. IT/OT data silos are a thing of the past – optimization potentials become visible quickly, driven by data, and efficiently.
This means for you:
Reliable data: Get real-time data that accurately represents your shop floor. Thanks to the Power BI connector, you receive reliable results in Power BI reports – ideal for executives, finance, sustainability and production managers, process engineers, data analysts, and quality assurance managers.
Unlimited applications: Machine data offers added value for almost every department of a manufacturing company. By enriching it with additional data in Power BI and flexibly visualizing it, the use cases are nearly limitless – from production costs to energy monitoring to ESG analyses.
Quick start: All you need is Power BI and ENLYZE – no complicated integrations, no technical jargon.
Scalable as needed: No matter how big your vision for the shop floor is – the solution grows with you and helps you utilize machine data maximally value-adding.

This is how easy it is to get started with the ENLYZE Power BI integration
ENLYZE users can start here. The integration is installed with just a few clicks:
Install Power BI Desktop
Download the ENLYZE Power BI Connector and follow the simple installation instructions.
Connect your production data and start creating your individual dashboards.
Our support team is, of course, at your disposal to assist you with the setup and integration.
Not yet an ENLYZE user? Talk to our sales team for a free consultation on machine data analysis.
Read more


